4
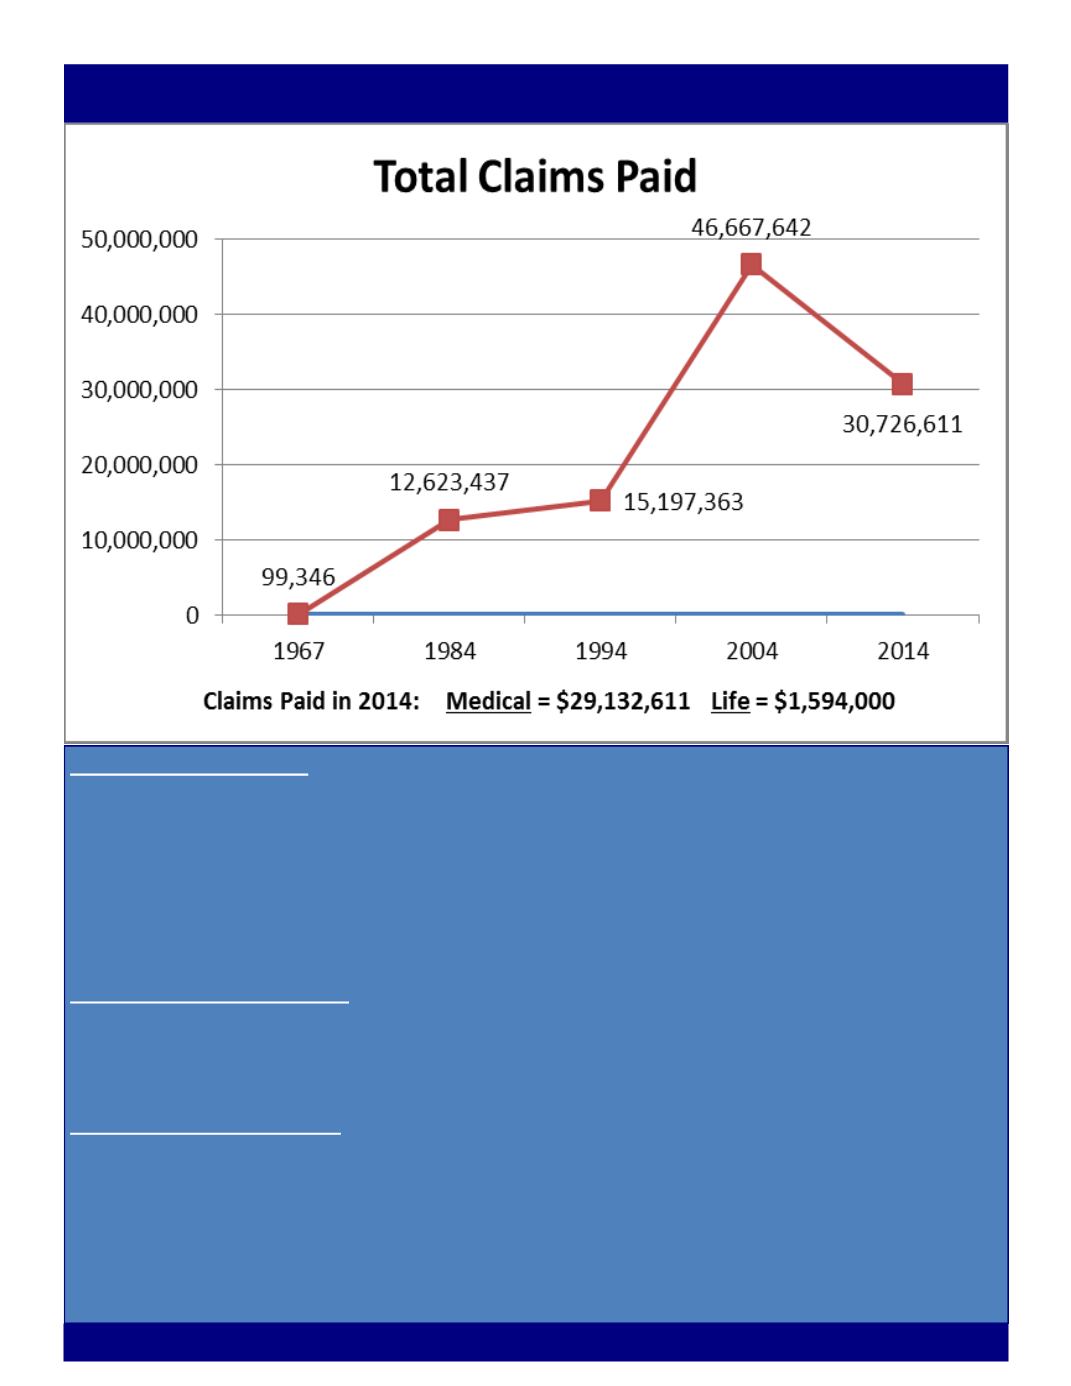
Claims Payment Trends.
As the graph above depicts, claims payments by the Trust increased
steadily in the 1980s and into the 1990s. After the mid-1990s, the increase in claims payments
accelerated. This was due, in part, to the elimination of the age 60 eligibility requirement in 2000,
and the prescription drug benefit the Trust made available in January 2002. In 2014, the overall net
plan cost decreased by 2.2% from 2013, however, prescription drug claims continue to be a growing
share of the Trust’s total costs. In 2014, prescription drug claims totaled nearly $14 million, or 47%
of the claim payments made. Non-Medicare eligible participants comprise 16.6% of total
participants, but approximately 48% of total claims paid.
Prescription Drug Coverage.
In 2014, 87.6% of prescriptions were for generic, and this rate
exceeds comparable plans by 4.8%. In addition, 98.2% of participants have selected a generic or
preferred prescription drug. The use of generics and preferred prescription drugs is a significant
savings to the participants and the Trust.
High-Cost Specialty Drugs
is one element of pharmacy benefit programs that continues to grow at
a much faster rate than the rest. Specialty drugs, which include biologics, injectables, and other
pharmaceutical innovations, are no longer an emerging category of pharmacy. They are a fact of life
and a growing portion of overall pharmacy benefit spending.
In 2014, the prescription plan cost per member per month (PMPM) trend on specialty drugs is
21.7%, compared to a 5.8% plan cost PMPM trend on non-specialty drugs. The number of scripts
for specialty drugs decreased by 1.9% in 2014, but the cost per script increased 24%.
Factors Affecting the Trust


